
INVESTIGATION | November 4, 2026 — By Lotta Goddess
In Boston, a public stadium built for schoolchildren is being remade at a projected construction cost exceeding $325 million. Meanwhile, longtime Black residents describe watching their families’ houses become someone else’s investment opportunity. The two stories are not identical, and a stadium lease does not by itself prove a plan to remove residents. But both sharpen the same question: when an American city becomes more valuable, who gets the benefits—and who can still afford to live there?
Filmmaker Sabrina Salvati’s documentary Removed: Black Erasure in Boston traces redlining, urban renewal, gentrification and criminal-justice inequalities through residents’ memories. In a conversation with Natali Morris, Salvati and Franklin Park advocate Renee Welch call attention to one particularly charged example: Boston’s White Stadium redevelopment.
The documentary supplies eyewitness accounts and a critical interpretation; city documents, historical archives, scholarly data and a major August 19, 2026 court ruling provide an essential second record. Taken together, they show a documented history of discriminatory systems, measurable housing pressure and genuinely contested present-day public choices—not proof of a single secret master plan.
Watch the source material
Video 1 — DISTURBING: How U.S. Cities Are FORCING Black Families Out — Natali Morris’s interview with Sabrina Salvati and Renee Welch. This is an interview expressing the participants’ perspectives, not independently verified footage of every claim discussed.
Video 2 — REMOVED: BLACK ERASURE IN BOSTON | Full Documentary — Salvati’s original feature-length documentary, an advocacy-centered account containing interviews and historical material.
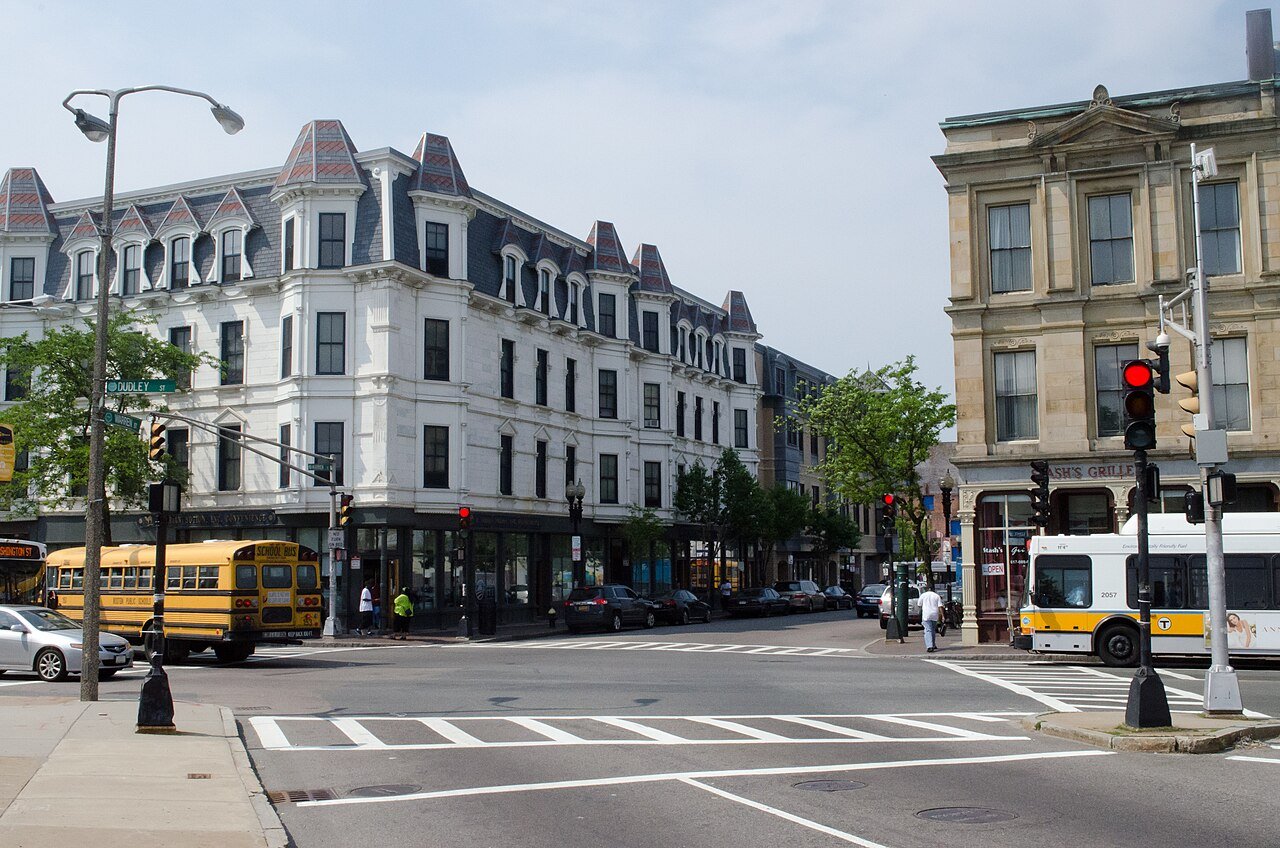
PART I — BOSTON: THE MACHINERY OF DISPLACEMENT
The Great Migration: Boston promised opportunity, but not equal access
For generations, Black families migrated north in search of wages, safety, education and a future beyond the racial terror and legal discrimination of the Jim Crow South. Boston also became home to Caribbean, African and Afro-Latino immigrants, whose histories are not interchangeable with those of U.S.-born African Americans. Boston Indicators’ 2023 regional profile details that growing diversity.
Salvati argues that the city’s changing geography tells a story of exclusion: Black communities that once had a presence in centrally located areas later became more concentrated in Roxbury, Dorchester and Mattapan, as financial opportunities accumulated elsewhere. There is real history behind that pattern—but it cannot be reduced to the idea that all families left for the same reason. Some relocated under pressure; others moved by choice to buy homes, join family networks or establish new suburban communities.
By 1980, 76% of Greater Boston’s Black population lived inside Boston; by 2020, 64% lived outside the city, according to Boston Indicators. Greater Boston’s Black population grew during those decades, even as its center of gravity shifted. That is evidence of suburbanization and an affordability problem, not a census count of people literally expelled. The distinction matters if the goal is to identify actual mechanisms and remedies.
Redlining: the map that turned prejudice into a property market
One of the most visible archival records is the 1938 Home Owners’ Loan Corporation residential security map of Boston. Neighborhoods received color-coded lending-risk grades. The Leventhal Map & Education Center explains how race and ethnicity influenced those judgments. Redlined districts were commonly marked as hazardous, reinforcing an ecosystem of discriminatory appraisal, lending and investment.
These maps were not a single binding order to every bank to reject every applicant. They were a record and instrument of a wider system in which Black households faced constrained mortgage access, restrictive real-estate practices and barriers to financing improvements. Denied capital, families could have difficulty keeping properties in good repair; property values then reflected both physical conditions and the discriminatory conditions that helped produce them.
It is easier to discuss a rising rent than to measure a mortgage a grandmother could not obtain in 1940. But missing ownership opportunities compound across decades: a house that was never purchased cannot be refinanced for a child’s education or passed to the next generation.
Urban renewal: homes demolished in the name of renewal
Mid-century planners promised to replace deteriorated housing, build roads and modernize the city. In practice, urban renewal often used eminent domain to clear occupied neighborhoods. The West End Museum estimates that more than 12,000 West End residents were forced out during the 1950s renewal program, with inadequate relocation assistance; the West End was not exclusively a Black neighborhood, which underscores that clearance could damage multiple working-class communities.
In Roxbury, the record is more complicated than a purely top-down scheme. A Boston historical study documents local organizations that asked for investment to reverse disinvestment, while other renewal and highway plans threatened residents’ homes. Local support for better housing did not amount to consent to every clearance decision.
Salvati recounts the experience of documentary participant Rod Singleton, whose family, she says, lost an owned home to eminent domain and moved into rental housing. That testimony deserves attention as an individual account; a property deed, taking record and compensation file would be needed to determine the legal terms and full financial loss in that specific case. The broad historical fact is clear: an owner displaced from property can lose not just shelter but the chance to retain future appreciation.
The highway that did not arrive
The proposed Southwest Expressway, an extension of Interstate 95 through Boston, provides an especially stark example of the cost of plans abandoned after they had already changed the ground. The city’s Highland Park historic study records demolished houses and buildings along Columbus Avenue and near Valentine Street ahead of highway and connector projects that were ultimately stopped after community resistance.
For the households who lost homes, cancellation did not restore what had been cleared. For the wider city, successful opposition helped prevent additional destruction. Both things can be true: organizing achieved a major public victory, and some residents had already paid an irreversible price.
School segregation: Black parents sought resources and equal rights
The interview recalls Black parents demanding school equality—not merely a longer bus ride. The National Archives’ case materials and the 1974 federal decision in Morgan v. Hennigan confirm that Boston officials intentionally maintained school segregation. Judge W. Arthur Garrity’s remedies included redistricting, busing and other educational reforms.
It would be misleading to say the dispute was only about school buses—or to suggest that federal intervention appeared without evidence. The underlying complaint concerned unequal educational opportunity and official discrimination. Desegregation efforts also met protests and violence. Today’s debates about school spending, transportation and neighborhood change carry the memory of institutions that demonstrably did not treat all children alike.
Rent control: a real policy dispute, not a proven single cause of Black property loss
Welch argues that Boston’s earlier rent controls prevented some small Black and brown landlords from raising rents to cover taxes and maintenance, contributing to the loss of family properties. That is an account worth investigating, especially because small owners and corporate landlords have very different access to capital.
But the available record does not establish that rent control broadly caused Black property loss in the South End. Boston’s official rent-control timeline shows a complex, steadily weakened system that began around 1970; Massachusetts voters eliminated rent control statewide in 1994. Proponents emphasized tenant stability, while opponents cited owner costs and maintenance burdens. A credible causal finding would require property-level records, race-specific ownership data, tax and financing histories—not a single explanatory anecdote.
The more useful question is how to protect low-income renters and small resident landlords without making either more vulnerable to foreclosure and speculative acquisition.
The wealth gap: what happens when a house never becomes an inheritance
A landmark 2015 study from Duke University, The New School and the Federal Reserve Bank of Boston found a median net worth of roughly $247,500 for white households in its Boston metropolitan survey, versus near zero for the sample of U.S.-born Black households. Those are historical survey estimates for specific populations, not a current count of every Black Boston household. The report also documented substantial differences in homeownership and financial assets.
The disparity makes a single lost family property unusually consequential. Owning an appreciating house is not a guarantee of prosperity, and renting is not a personal failure. But a family denied an opportunity to own often loses a financial buffer that wealthier households take for granted. That gap becomes more important as neighborhoods get expensive.
When the affordable housing definition is not the household’s definition
Salvati and Welch question new projects advertised as “affordable.” Their central criticism has a verifiable foundation: many housing programs define eligibility as a percentage of area median income (AMI), not the income of current tenants on one Roxbury block.
For 2026, published income schedules for the Boston–Cambridge–Quincy, MA–NH HUD metro area put the 80%-of-AMI threshold at about $96,000 for one person and $137,100 for a four-person household. These are eligibility ceilings in particular programs, not claims that households earn those salaries or that all income-qualified families can afford every unit. In contrast, 30%- and 50%-AMI housing targets serve substantially lower-income households.
A Boston community health assessment using 2019–23 data estimated that about 57% of Roxbury renter households and 65% of Mattapan renter households spent at least 30% of income on housing. That is a direct affordability warning. Welch alleges that some high-rent developments remain partly vacant and that commitments are watered down late in construction. Those particular occupancy and developer-compliance claims require a project-by-project audit; the interview alone cannot establish how many units are empty or why.
A new address is not necessarily a new opportunity
Welch describes households moving from Boston to Brockton, Taunton or farther south. Boston Indicators documents growing Black populations in Brockton, Randolph, Lawrence and Lynn, including Brockton becoming majority-Black in the 2020 census. Some households built promising lives in those cities. Others faced longer commutes, higher transportation costs or the disruption of leaving school and family networks.
When a family moves from a transit-rich neighborhood to a place where a car is nearly indispensable, the apparent savings on rent can be partly consumed by travel. But assigning every relocation to eviction would flatten the evidence. Better measurements include eviction and foreclosure records, rents, travel times, housing-voucher utilization, school transfers and whether the household wanted to move.
White Stadium: the $325 million test case for public investment
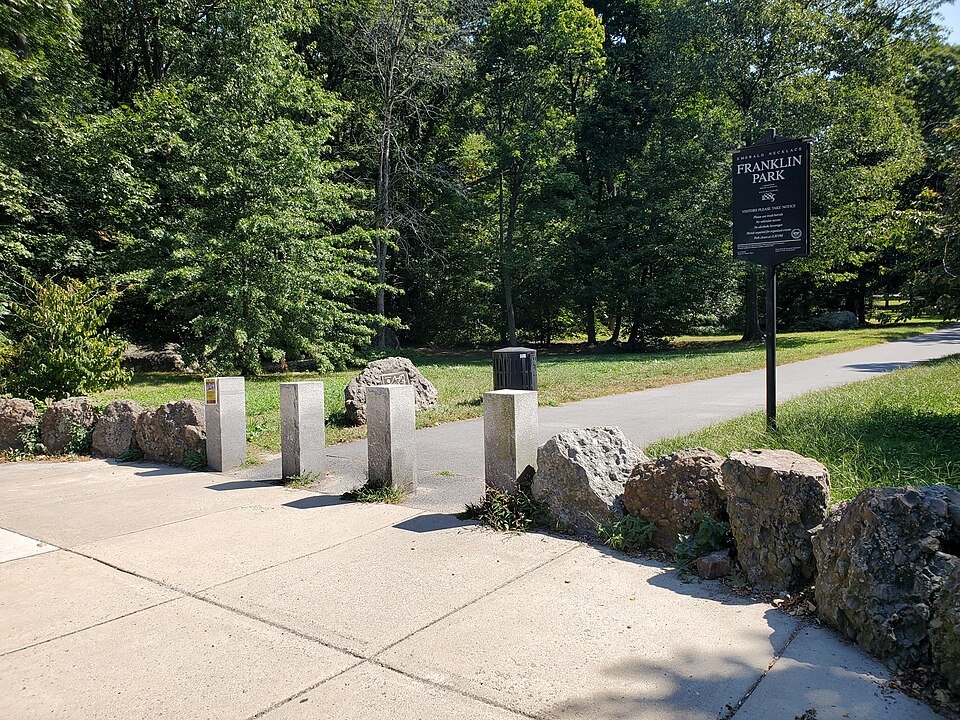
White Stadium in Franklin Park opened in 1949 and has served Boston Public Schools athletics, community events and generations of neighborhood residents. The city says the aging facility lacked essential amenities, and that its redevelopment with National Women’s Soccer League club Boston Legacy FC will provide year-round training areas, accessible facilities and greater public hours.
What is publicly documented is a public–private construction and use arrangement. As of the city’s February 2026 update, Boston’s construction share is capped at $135 million under a guaranteed-maximum-price contract, while the team has committed about $190 million for its side, for a total above $325 million. The total is much higher than early estimates. Boston says the stadium remains a city-owned, Boston Public Schools asset; private team use is governed by lease and stadium-use agreements. That is a significant private commercial interest in a public venue, not a documented outright sale of the entire stadium.
Welch calls the arrangement a transfer of public value to private sports interests and says neighborhood residents lacked meaningful influence at its inception. The Emerald Necklace Conservancy has advocated a lower-cost, public-only alternative, while critics cite traffic, park access and whether children will lose scheduling priority. The city counters that public access will expand from limited weekday availability to 6 a.m.–9 p.m. daily outside event restrictions and that the new complex delivers facilities Boston otherwise struggled to finance.
Both benefit claims and costs require scrutiny. The city’s announced contracting goals, projected jobs and school facilities are policy arguments with testable outcomes; so are opponents’ concerns about access and the public cost. The interview’s assertion that the entire $135 million came directly from current classroom funds, and its specific teacher-layoff comparison, should not be treated as established without budget-line documentation. Construction spending, operating budgets and teacher positions are not automatically the same appropriation.
The lawsuit: what Massachusetts’ highest court actually decided
The documentary and interview reflect years of protest and legal action by Franklin Park advocates, including Welch, whose name appears among plaintiffs. The key update is now a final state-high-court ruling: on August 19, 2026, the Massachusetts Supreme Judicial Court affirmed judgment for Boston in Emerald Necklace Conservancy, Inc. v. City of Boston.
The court held that 1947 and 1950 legislative actions had converted the stadium parcel’s legal status from parkland to a school facility before Massachusetts’ Article 97 parkland protections took effect. The agreements therefore did not require a new two-thirds legislative vote for the stadium parcel. It also rejected challenges concerning access and improvements elsewhere in Franklin Park. Plaintiffs lacked standing to enforce the public charitable trust provisions as framed in their lawsuit.
That is a legal defeat for the challengers, not a ruling that every economic or social concern about the project is imaginary. Equally, critics’ moral objections cannot be described as a court finding that the city illegally transferred protected parkland. The distinction is basic but crucial.
Stadiums, neighborhood brands and political power
Salvati argues that developments can trigger investor interest in surrounding real estate before construction is visible. That is a plausible housing-market mechanism, but proof of specific speculative purchases near White Stadium requires land-registry records showing who bought what, when and through which entities. The interview does not provide such a verified transaction list.
Welch also criticizes language such as “White Stadium District” and says familiar neighborhood identities are disappearing. Marketing can absolutely repackage a place for outsiders, but a promotional district label is not necessarily an official city renaming. A careful investigation should distinguish advertising, zoning documents, municipal maps and resident usage.
The broader concern—whether taxpayer-backed projects improve neighborhood life for existing residents—is legitimate even when a particular allegation remains unproven. A useful public audit would disclose lease terms, event-day closures, annual school hours, local business awards, nearby property sales and tax abatements.
Opportunity Zones: a tax incentive is not proof of a stadium financing scheme
The interview ties development pressure to federal Opportunity Zones and suggests a political benefit. The actual law was established by the 2017 Tax Cuts and Jobs Act, not a 2016 statute. Massachusetts’ 2026 program description explains that qualifying investments in federally designated distressed census tracts may receive capital-gains tax benefits. The 2025 federal law made the program permanent with new designation rounds beginning in 2027.
Critics of Opportunity Zones question how often investors benefit compared with incumbent residents; defenders argue that tax incentives attract capital to underserved areas. But the existence of Opportunity Zones does not prove that Mayor Michelle Wu personally profits from a designation, that White Stadium financing uses a qualified fund, or that the stadium’s construction schedule is driven by a particular tax deadline. Those are separate claims requiring financing disclosures and investment records.
Universities: when an anchor institution expands into a neighborhood
Salvati, a Northeastern University alumna, describes discovering how much of the university’s surrounding area had historically been associated with Roxbury. University expansion can reshape land values, commercial tenancy and student-housing demand; its consequences can be especially controversial where residents already have less leverage.
The historical stakes are documented in Northeastern’s archives of the Lower Roxbury Community Corporation, formed in 1966 partly to help residents respond to redevelopment proposals and possible displacement. However, the interview’s specific suggestion that a ZIP code was deliberately changed so that Northeastern would not be associated with Roxbury has not been independently substantiated here. ZIP codes are postal instruments; an explanation requires records, not an inference from present-day branding.
Universities can provide jobs, research, health services and education while also increasing pressure on adjacent neighborhoods. The relevant measure is whether expansion includes meaningful housing protections, community governance and public accounting for property changes.
Mass incarceration, reentry and the housing trap
Removed also raises mass incarceration as a component of Black economic exclusion. The mechanism is different from redlining, but the pressures can reinforce each other: criminal records can limit employment and some housing options; imprisonment can interrupt earnings, mortgage payments and childcare; and families absorbing legal and travel costs may have less capacity to retain property.
That does not mean every displaced family has experienced incarceration or that any one incarceration statistic explains Boston’s present housing market. A complete local investigation would connect Massachusetts corrections and sentencing data, housing admissions rules, reentry outcomes and neighborhood-specific eviction records. Treating incarceration as a documented structural concern is justified; assigning it a precise share of Boston’s housing losses without such analysis is not.
Public transport: access can improve without curing displacement
The conversation mentions Blue Hill Avenue bus-lane changes and expresses concern that mobility projects can prioritize commuters over residents. Transportation investments can reduce trip times, but also redistribute curb space, affect local businesses and change expectations for nearby property. Whether the particular Blue Hill Avenue project harms or benefits residents requires before-and-after travel data, pedestrian safety, rider surveys and business impacts—not assumptions about who rides the buses.
Displacement is costly in ways housing statistics alone miss. A household moving farther from Boston may need a vehicle, pay for parking and lose hours to commuting; a household remaining in a more walkable neighborhood may enjoy important savings that are invisible in the rent. Transportation equity and housing stability therefore have to be evaluated together.
PART II — THE NATIONAL PAPER TRAIL: WHERE BLACK NEIGHBORHOODS WERE REMOVED
Boston’s story does not begin—or end—at the Massachusetts border. The same vocabulary appeared in different eras: blight removal, urban renewal, civic improvement, economic development. Sometimes government obtained property directly, sometimes institutional partnerships cleared occupied blocks, and sometimes private markets imposed pressures that did not require an eviction order. What follows is not a list of identical conspiracies. It is a trail of decisions, deeds, maps, official histories, demolition records and recovery programs. A structural pattern becomes more meaningful when each claim can be checked.
Miami, Florida: the route through Overtown
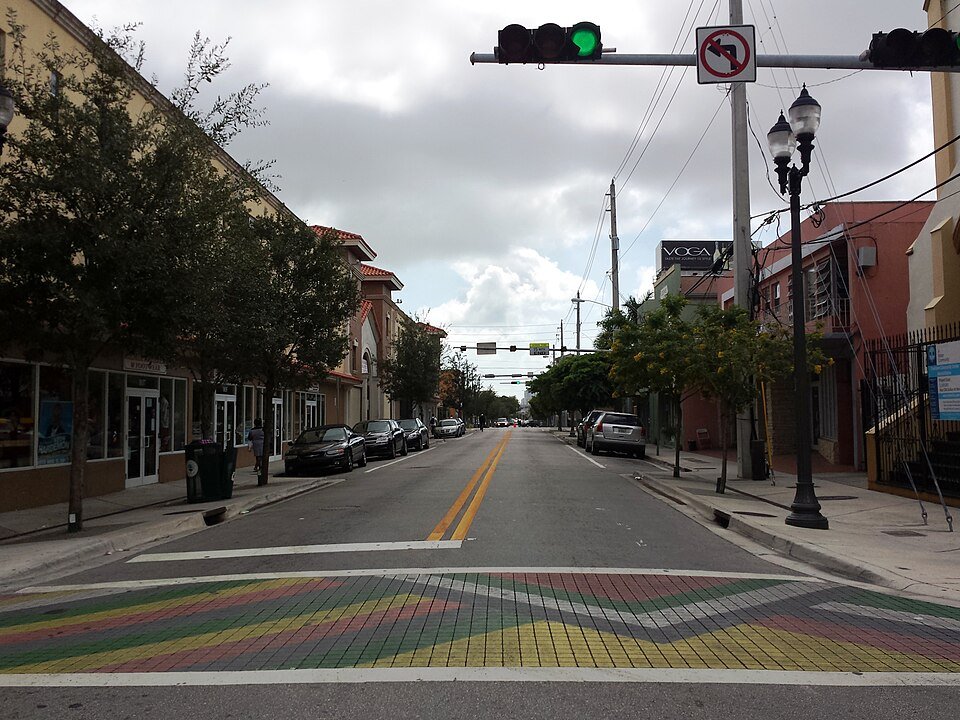
Overtown was the center of Black cultural and commercial life in segregated Miami, with hotels, theaters, churches and businesses serving people excluded elsewhere. The University of Miami Libraries’ historical archive identifies a 1956 highway-route decision that prioritized space for expansion of the downtown business district over an alternative route less damaging to Overtown. The building of I-95 and associated roads then removed homes and commercial blocks and fractured the neighborhood’s geography.
The university’s historical account estimates Overtown’s population declined from about 40,000 to about 10,000. Those figures summarize a broad historical change, not a precise census of families physically evicted on one date. But the physical destruction is beyond dispute: the road was planned, the route approved and existing properties cleared. The Segregation by Design archive offers aerial comparisons showing how the streetscape changed.
Overtown remains important culturally, and redevelopment has produced new business activity. The question is not whether the neighborhood was allowed to change; it is whether the households whose property, social networks and businesses absorbed the earlier public costs received a realistic path into its later prosperity.
Portland, Oregon: Albina, a hospital and 300 promised replacement homes
Portland supplies unusually direct documentary evidence. The City Archives published its original Emanuel Hospital relocation files, documenting property assessments and the attempts to relocate families and businesses during urban renewal. The hospital expansion site encompassed 55.3 acres with nearly 300 homes in Albina, long a center of Black Portland. When expected federal funding failed to materialize, land that had been cleared remained unused for years.
A city historical review counted 188 purchased and demolished properties during 1971–73, including 158 residential and 30 commercial properties. Of 171 households displaced in that phase, the review says 74% were Black and 32% were homeowners. The report also notes 101 properties acquired earlier by the hospital privately, with an incomplete record of their former occupants.
Under pressure from residents, the hospital, redevelopment agency and public institutions signed a 1971 agreement promising 180–300 replacement housing units. Portland’s housing bureau acknowledges that those replacement units were not built. The paper trail makes the stakes visible: families were moved first, homes were demolished and the promised local housing did not arrive. Memorial Coliseum and Interstate 5 had already contributed to dislocation in Albina. A reader need not rely on an allegation of secret coordination to understand the cumulative effect.
Detroit, Michigan: Black Bottom and Paradise Valley
Detroit’s Black Bottom was a predominantly Black residential neighborhood; nearby Paradise Valley was a partly overlapping but distinct center of Black entertainment, commerce and culture. The Detroit Historical Society documents the late-1950s and early-1960s clearance of Black Bottom for the Lafayette Park residential development and a freeway. Its Paradise Valley history recounts the loss of businesses and buildings during I-375 construction and renewal.
Lafayette Park became an internationally recognized modernist development. There is room to acknowledge architectural achievement while also examining the people removed from the site. The same historical society describes the lack of comparably affordable options for former Black Bottom residents. What replaces a neighborhood can be impressive without replacing the opportunities, ownership and mutual support that were lost.
Philadelphia, Pennsylvania: the university–government redevelopment corridor
Philadelphia offers a closely related institutional example. In the 1960s, the city’s Redevelopment Authority designated West Philadelphia’s Black Bottom area for “Unit 3” renewal. The planned centerpiece was the University City Science Center, supported by a coalition including major educational institutions. The University of Pennsylvania’s own historical project documents opposition to the clearances and the 1967–68 demolition of occupied blocks.
Another Penn historical account estimates that more than 2,000 residents, predominantly African American renters, were displaced. The university archives provide a striking census comparison: 333 of the redevelopment area’s 429 occupied units in 1960 housed residents classified as nonwhite; by 1970 only 15 housing units remained in the area. The archives discuss the controversy surrounding Penn’s role rather than concealing it.
This is the kind of document-backed institutional expansion that makes Salvati’s criticism of universities near Roxbury worthy of examination. Education, medical innovation and research investment deliver public benefits. The question is whether they require vulnerable neighbors to surrender ownership and whether displacement safeguards are binding rather than ceremonial.
Oakland, California: West Oakland and the freeway ledger
Oakland’s official history of racial exclusion acknowledges how Highway 17, now part of I-880, and the Cypress Viaduct cut through Black West Oakland, damaging homes and community businesses. Later transit and redevelopment projects added to the upheaval. In other words, the city itself recognizes that public works have contributed to displacement.
For I-980, Caltrans’s present-day planning record details the removal of 503 houses, four churches and 22 businesses, over an area exceeding 42 acres. Those numbers refer to that freeway project, not all of West Oakland’s twentieth-century losses. The adjacent transport system also provided regional mobility; the benefits and the neighborhood harms fell on different populations.
Oakland’s present discussions about reconnecting divided land can be judged against these records. If a highway barrier is removed but its reclaimed parcels become unaffordable to people nearby, physical reconnection may not bring housing or economic restitution.
Seattle, Washington: the Central District loses its Black majority
Seattle’s racial-demographics report documents a history of restrictive housing covenants and redlining that concentrated Black households in areas including the Central District. It also recognizes that gentrification and living costs have pushed communities of color into other parts of King County.
The city’s historical account of its “Weed and Seed” initiative reports the Central District was about 75% Black in the 1970s and approximately 15% Black in the mid-2020s. It examines policing and criminal-justice policy as part of the neighborhood’s story. Those percentages show racial composition changing; they do not mean that 60% of residents were formally evicted. The different question is how much of the change came from unaffordable rents, sales, foreclosures and other constraints on staying.
Washington, D.C.: a housing boom without a Black majority
In 1970, Black residents accounted for roughly 70% of Washington, D.C.’s population; by the late 2010s, their share had dropped below half. The chronology is discussed in a peer-reviewed study on gentrification and policing. Migration, births, deaths and housing changes all influence these percentages, so a demographic chart is not a displacement ledger.
More recent development was spatially concentrated. Brookings researchers studying 2000–2020 construction found a disproportionately large share of new housing in a small number of centrally located neighborhoods. New housing supply can also ease shortages; the problem is not that every building displaces a neighbor. The public test is whether incumbent low-income tenants, longtime owners and businesses have enforceable protections as land values rise around them.
New York City: from Seneca Village to contemporary deed theft
New York has one of the clearest nineteenth-century examples of a Black property-owning community cleared for a public amenity. The Central Park Conservancy documents Seneca Village, founded in 1825. By the mid-1850s it had around 225 residents, about two-thirds of them Black, plus churches, a school and comparatively high rates of landownership. The city acquired the property for Central Park in 1857, forcing residents to leave.
That episode was an exercise of eminent domain, not a twenty-first-century property scam. Today’s separate issue is deed theft: forgeries, fraudulent transfers and predatory transactions that can strip valuable homes from longtime owners. In April 2026, New York City established an Office of Deed Theft Prevention. The city identifies vulnerable seniors, immigrants and homeowners in historically Black neighborhoods among targets; complaints have been particularly concentrated in Brooklyn and Queens, not exclusively Harlem.
The common element is the value of title to land. The mechanisms and responsible actors differ sharply. Calling all deed transfers suspicious, or assuming city collusion in every fraud case, would exceed the evidence.
New Orleans, Louisiana: Katrina, return, and rebuilding that reflected old inequities
Hurricane Katrina was a natural disaster; the housing recovery was shaped by human policy. A 2026 peer-reviewed study estimates approximately 53,000 Black adults from Orleans Parish were displaced long-term from the metropolitan area, roughly one-quarter of the pre-storm Black adult population. Its methods and scope matter: this is a statistical estimate of long-term movement after the 2005 hurricane, not an inventory of people evicted by developers.
Louisiana’s Road Home reconstruction program became the subject of discrimination litigation involving grants based on pre-storm property value—a formula that could disadvantage homes in historically undervalued Black neighborhoods. A federal settlement agreement documents changes to address the claims. In neighboring St. Bernard Parish, the Justice Department announced a settlement in 2013 resolving alleged post-Katrina housing restrictions that disadvantaged Black renters.
The distinction is fundamental. No evidence here establishes that investors caused Katrina or that every new development was predatory. There is documentary evidence of discriminatory effects and contested official housing decisions during the recovery, layered atop the disaster itself.
Los Angeles and Inglewood: a stadium comparison that needs care
Salvati invokes SoFi Stadium as an example of sports redevelopment. A factual correction is essential: the stadium itself stands on the former Hollywood Park racetrack site, not a parcel proven to have been a demolished Black residential neighborhood. Inglewood’s historic Black communities nevertheless face genuine concerns about housing costs, property speculation and the consequences of large entertainment investments. The measurable questions are who owns the surrounding parcels, how rents and evictions changed, and whether existing residents share in new opportunities.
That is how the stadium analogy should be tested rather than overstated. In Boston, too, a stadium project can be legally authorized while its wider social costs remain disputed.
What the national records establish—and what they cannot
The archival evidence firmly documents direct clearance in Miami, Portland, Detroit, Philadelphia, Oakland and New York’s Seneca Village. Seattle and Washington show longer-running demographic changes driven by multiple forces. New Orleans shows how a disaster compounded historical inequality. Inglewood illustrates why a plausible development concern still needs a parcel-specific demonstration.
These histories do not prove that all American mayors follow one centralized secret blueprint. They show something more concrete: public institutions repeatedly pursued roads, redevelopment, campuses and other projects while failing to guarantee that existing Black residents could preserve property, housing access and neighborhood ties. Each city has its own defendants, decision-makers, laws and public records—and each deserves to be investigated on those terms.
PART III — THE ACCOUNTABILITY TEST: WHO CAN AFFORD TO STAY?
A credible anti-displacement program has to distinguish residents who wish to remain from residents who voluntarily move; renters from small landlords; loss of housing from changes in neighborhood demographics. It also needs measures that can be checked over time:
- Protect existing residents: targeted eviction prevention, home repair support, property-tax assistance for qualified low-income longtime homeowners and accessible legal aid against predatory transfers.
- Build the right housing: publish units, prices, eligibility bands, occupancy and compliance by project; prioritize deeply affordable units and pathways to ownership where feasible.
- Follow the property: release transparent records of land acquisition, public subsidies, resale restrictions, affordability expirations and the real owners of major redevelopment parcels.
- Make public deals auditable: report White Stadium school-use hours, public access, cost changes, private lease rights and neighborhood business outcomes annually.
- Let residents influence the initial design: a comment meeting after commitments are made is not the same as shared power over alternatives, public resources and displacement safeguards.
The question Boston cannot answer with a ribbon-cutting
Renee Welch says she can now count only two Black families on a street that once held many more. That is personal testimony, not a citywide demographic survey. But numbers and memories illuminate different halves of the same issue. Boston Indicators documents a growing Black region with an increasingly suburban population; archival maps and court rulings document past discrimination; modern housing measures show pressure on existing renters. And a multimillion-dollar stadium partnership tests whether public investment delivers benefits that current neighbors actually receive.
Boston’s highest court has answered the legal question about White Stadium’s parkland protections. It has not decided whether the city made the best use of its money, nor whether the families who sustained these neighborhoods will be able to stay for the next generation.
When Boston announces progress, who gets to live close enough to enjoy it?
Primary documents and further reading
- Massachusetts Supreme Judicial Court, Emerald Necklace Conservancy v. Boston (August 19, 2026).
- City of Boston: White Stadium project, leases, access and cost documents; WBUR reporting on the 2026 cost increase.
- Boston Indicators, Great Migration to Global Immigration (2023); Residential Segregation in Greater Boston (2025).
- Federal Reserve Bank of Boston, The Color of Wealth in Boston (2015).
- Mapping Inequality: original Boston HOLC maps; Leventhal Map & Education Center.
- West End Museum: urban renewal chronology; Boston Highland Park historic study.
- National Archives: Morgan v. Hennigan; Boston rent-control timeline.
- Emerald Necklace Conservancy: White Stadium alternative and objections.
- Massachusetts: 2026 Opportunity Zone program; New York AG: deed theft.
- Sampan interview with Sabrina Salvati; EURweb’s coverage of Removed.
- Gary International Black Film Festival film listing (provided by filmmakers; live page not independently confirmed).
National case-file sources
- Miami: University of Miami Libraries’ Overtown history; historical aerial comparisons.
- Portland: original Emanuel relocation files; city timeline and relocation counts; replacement-housing history.
- Detroit: Detroit Historical Society, Black Bottom; Paradise Valley.
- Philadelphia: University of Pennsylvania archives; Unit 3 displacement research.
- Oakland: City of Oakland history; Caltrans Vision 980.
- Seattle: city racial demographics; Central District archive.
- Washington: Brookings housing research; peer-reviewed demographic study.
- New York: Seneca Village history; NYC deed-theft prevention office.
- New Orleans: 2026 Katrina long-term-displacement study; HUD Road Home settlement; Justice Department settlement.
- Inglewood: HKS architects’ SoFi Stadium site history.
Reporting note: This article analyzes published source materials and existing interviews; Apep Bar did not independently interview the participants or obtain unseen case records. The legal status and project figures are current to the cited records available November 4, 2026. Historic photographs are illustrative of the documented locations, not evidence of a specific eviction. No generated images are presented as photographs.