

INNOVATION / SCIENCE — OCTOBER 28, 2026. Imagine aiming a camera at a roaring machine and watching bright colors reveal exactly where its noise originates. It looks like science fiction—or an upgrade for people who have always wanted their ears to come with subtitles. But acoustic imaging is real. A video shared by the creator Marques Brownlee titled “This can SEE Sound!” demonstrates an acoustic imaging camera, a technology that translates measurements from multiple microphones into a visual map of sound sources.
The exact make and model shown in the Short could not be verified from the publicly accessible video information. This investigation explains the documented technology and real-world applications, without inventing specifications for the device in the clip.
What are we actually seeing?
A visual image with brightly colored spots appears to show sound itself. In reality, an acoustic imaging camera does not photograph pressure waves as if they were ordinary light. It measures sound with multiple microphones, estimates the direction or location of dominant sound sources, and overlays a computed sound-intensity map on an ordinary visual image. The apparent ‘heat map’ depicts acoustic information, not temperature.
The ingenious idea: many ears, one picture
A typical instrument has an array of microphones distributed across its face and a conventional visible-light camera. A sound wave reaches individual microphones at slightly different times. Those tiny differences contain directional information. By comparing the signals and accounting for microphone geometry, processing software estimates where sound energy is coming from. The resulting map makes an otherwise invisible phenomenon spatially intelligible.
Beamforming, explained without the mathematics
One common method is acoustic beamforming. The software mathematically steers a listening ‘beam’ toward candidate directions by applying time delays or phase adjustments to the microphone signals. Sound that is consistent with a particular direction adds together more strongly than unrelated signals. Repeating that calculation across the scene creates an acoustic map. Manufacturers may also use other localization or signal-processing methods, so every camera need not work identically.
Why this is different from an ordinary sound meter
A conventional sound-level meter can tell an operator how loud a location is, usually in decibels, but not necessarily which part of a complicated scene is responsible. An acoustic imager can help isolate a hissing valve from nearby machinery, trace a squeal to a mechanical component, or highlight a noise source among several candidates. An image is a diagnostic clue: it guides inspection rather than proving the underlying defect by itself.
Seeing a leak before it becomes a shutdown
Compressed-air and industrial-gas systems can lose energy through small leaks. Escaping gas generates turbulence and often ultrasonic sound. Some acoustic imagers filter or analyze high-frequency components, even above the range of human hearing, to help operators locate these leaks. Instruments used for this purpose can support maintenance in noisy facilities where workers otherwise might need time-consuming point-by-point checks. They detect acoustically active leaks; they are not chemical sensors that identify all gases or quantify every release without calibration and suitable conditions.
Electrical faults that cannot be seen with the naked eye
Partial discharge and related electrical phenomena can generate detectable acoustic energy. Certain industrial acoustic cameras are specifically engineered for this diagnostic work, allowing a technician to locate a suspect component from a safer distance where the procedure and equipment permit it. This does not authorize untrained users to approach live electrical systems: only qualified personnel should perform high-voltage inspections under appropriate safety procedures.
Machines, factories and the hunt for mysterious noises
Production lines produce layered sound: bearings, motors, pneumatic equipment, airflow, vibration, alarms and moving parts. Acoustic imaging can help show where a particular frequency band originates. Engineers may use it in quality control, noise-reduction design, automotive testing and fault localization. The same principle can assist designers studying unwanted aerodynamic or structural sounds.
Transportation and environmental noise
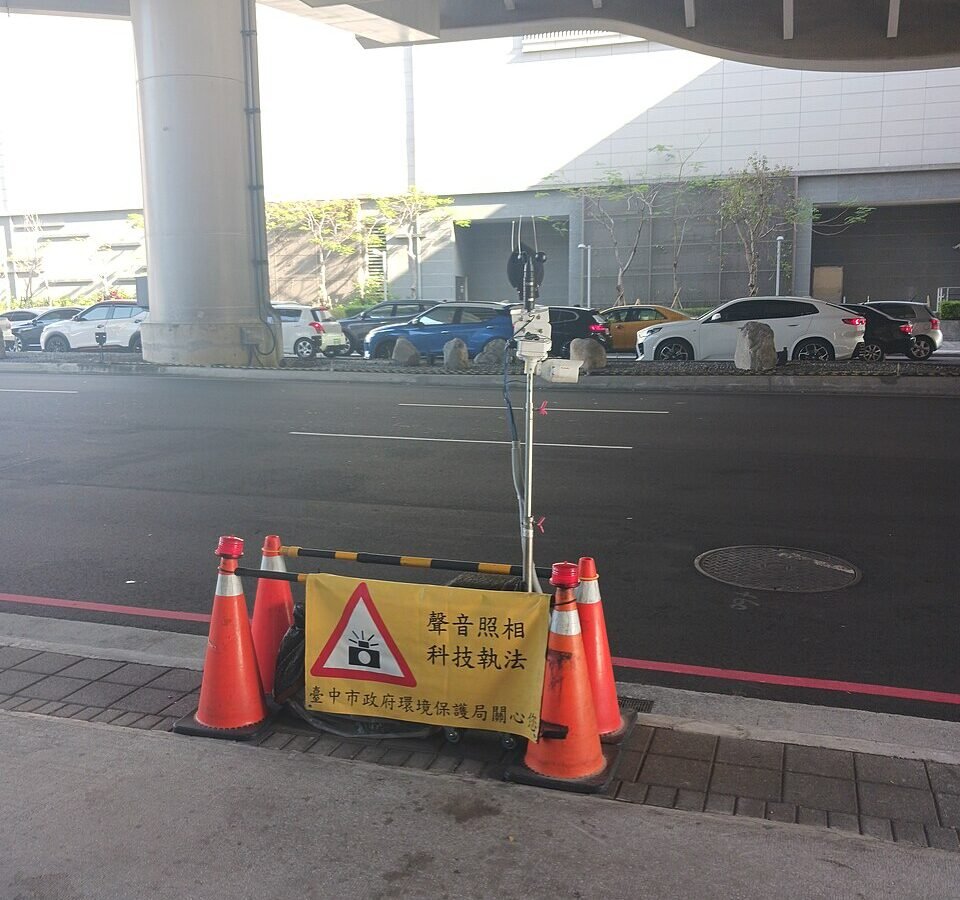
Fixed microphone arrays and acoustic-camera systems can be used to examine traffic-noise sources and identify particularly noisy vehicles under properly designed measurement conditions. The photograph accompanying this article shows a real acoustic-camera installation associated with vehicle-noise enforcement in Taiwan. It is not the same device demonstrated in the reader’s video, but it illustrates how sound-source localization moves from a laboratory concept into infrastructure.
What the camera cannot tell us
Acoustic images have limits. Results depend on frequency, microphone spacing, distance, ambient noise, signal-processing choices and whether sound reflects from nearby surfaces. A bright spot might indicate a reflection rather than the true origin. Some cameras are best at specific frequency bands, and the colors and scale on-screen may be adjusted for readability. Even a beautiful colored image is not direct evidence of what caused the sound; diagnosis still requires context and often another measurement.
Is it a breakthrough or just clever packaging?
Microphone arrays and beamforming have been developed over decades, including research in acoustics, sonar, radar-related signal processing and engineering diagnostics. The innovation in modern handheld acoustic imagers lies in making the components compact, computationally fast and usable by technicians in real time, often through an intuitive camera-like interface. The underlying physics is established; the accessibility and integration make the demonstration feel futuristic.
The next frontier: richer maps and better diagnostics
As sensing hardware, processing algorithms and edge computing improve, acoustic imaging could become quicker and more portable, with software that distinguishes likely leak sounds from unrelated machinery. Combining acoustic maps with thermal imagery, inspection records or machine-learning classifiers may improve workflows, but algorithms must be validated against real faults and false alarms. These are opportunities, not proof that a current device can detect every issue.
Apep Bar’s question
Human beings spent centuries trying to see what our ears can only hear. Now engineering can put a colored map of sound over the world in front of us. When a hidden leak, electric fault or distant noise finally becomes visible, what else have we been missing simply because we lacked the right instrument?
Original video and technical references
Marques Brownlee: This can SEE Sound! — YouTube Short · Fluke: Acoustic imaging and leak detection · Fluke: Example of an industrial acoustic imager · Wikimedia Commons: acoustic camera installation photo (CC0).
Editorial transparency: The full dialogue of the supplied Short could not be independently transcribed; its public title establishes the topic, not a particular manufacturer’s product specifications. Technical explanations draw on external acoustics and equipment references. The featured photograph is an acoustic-camera installation in Taiwan, credited to Saimmx (CC0, Wikimedia Commons), and does not show the exact model in Marques Brownlee’s video.