

INVESTIGATION & ANALYSIS | By Lotta Goddess | November 11, 2026
America wastes substantial food, produces enormous wealth and has an elaborate network of public programs. Yet tens of millions still cannot afford the basics. The contradiction is real. The explanation is more complicated—and more revealing—than a slogan about greed.
At one end of the American economy, food is discarded, property appreciates and wealth compounds. At the other, a parent calculates whether buying groceries will leave enough money for the electric bill. The two experiences can exist on the same street—or on opposite sides of a county line.
The latest Census Bureau estimates count 34.5 million Americans living below the official poverty line in 2025, or 10.2% of the population, even as median household income reached $87,460. The Census Bureau’s broader Supplemental Poverty Measure, which accounts for many benefits, taxes and certain expenses, put poverty at 13.1%. These are different measures, not interchangeable statistics. A lower national rate is meaningful progress; it is not proof that everyone left behind can pay the rent.
The headline “The Uncomfortable Truth About Poverty: There Is Enough for Everyone, but Not Enough for Greed,” circulated by Crafting Your Home through NewsBreak, captures an important moral argument. But what does “enough” mean, who can actually reach it, and which institutions set the price? We could not independently access the full underlying NewsBreak article, so this investigation treats that headline as a question to test—not as a verified list of the source author’s claims. The reporting below is drawn from independently linked official records, research and documented local policy.
1. The poverty line is not the cost of living
The official poverty measure relies on a nationally defined cash-income threshold that does not fully adjust for local housing prices or all noncash assistance. The 2025 Census poverty report and the Supplemental Poverty Measure describe two importantly different pictures. The supplemental measure incorporates housing-cost variation, taxes and transfers and work and medical expenses. Someone above the official line may still be one emergency away from arrears, particularly in an expensive metro area.
Picture three illustrative—not interviewed—households: a service worker renting a small apartment in an inner city; an aide in a suburban apartment complex who needs a car to reach scattered clients; and a rural parent whose mortgage is modest but whose only nearby hospital has lost services. Their largest expenses differ, but all three can be economically precarious. Low income is a denominator. Rent, child care, transportation, debt and health are the bills that arrive in the numerator.
A useful distinction: poverty measures resources below an official threshold; financial insecurity describes vulnerability even above it; wealth is accumulated assets minus liabilities. Public debate often blurs all three, making policies look more successful—or less successful—than the evidence permits.
2. Race does not determine hardship; history and access shape its unequal distribution
Economic hardship is not exclusive to any race. White families represent a substantial share of Americans facing financial distress, and poor rural counties, majority-Black neighborhoods, Latino suburbs, tribal communities and high-cost Asian American enclaves are not interchangeable. But equal exposure to an economic shock does not mean equal capacity to survive it.
The 2025 Census historical poverty tables report an official poverty rate of 17.3% for people classified as Black alone, 13.9% for Hispanic people of any race, and 7.5% for non-Hispanic White people. American Indian and Alaska Native populations face substantial disparities too, although estimates for smaller groups require particular attention to sample precision. Categories overlap where ethnicity and race are measured separately, and broad categories conceal major differences by ancestry, nativity, local economy and age.
Income is only half the story. The Federal Reserve’s 2022 Survey of Consumer Finances estimated median family wealth of approximately $285,000 for White families, $44,900 for Black families and $61,600 for Hispanic families. The estimated Asian-family median was higher still but masks enormous diversity within Asian American communities. These are 2022 wealth estimates, not a claim about 2026 balances. They illustrate why the same broken transmission or eviction notice can have different consequences.
Historic mortgage discrimination, segregation, land dispossession and uneven access to credit contributed to that gap. Federal Reserve research explains how redlining reinforced unequal housing investment; it does not mean every present-day disparity has one cause or that every community followed the same path. Tribal land tenure and federal policy, exclusion from some historical wealth-building opportunities, and contemporary local housing markets require their own evidence. See Apep Bar’s earlier investigation into federal land policy and inherited wealth.
3. Working, yet still trapped: the wage-versus-expense equation
“Get a job” is not a complete anti-poverty policy when a job’s hours fluctuate or its pay cannot cover local essentials. The problem includes wages, scheduling, labor-force barriers, disability, caregiving, employer benefits and the cost of getting to work. It is not a claim that all employers are exploiting workers or that every low-income adult can hold a conventional full-time job.
State and city boundaries can abruptly change the pay floor. As of the Department of Labor’s November 2026 state survey, the basic minimum wage in Texas is $7.25 an hour, while Washington state’s is $17.13. Seattle’s 2026 city minimum is $21.30. At a hypothetical 40 hours a week for 52 paid weeks, those hourly rates produce about $15,080, $35,630 and $44,304 in gross annual wages respectively. Real workweeks, taxes, exemptions, tips, overtime and housing costs change the outcome; these arithmetic examples are not a cross-state standard-of-living ranking.
Inner city: a worker may have more employers and public transit within reach, yet face competitive rents, short-notice schedules and high child-care costs. Suburb: jobs may be spread among shopping corridors, care facilities and warehouses without frequent buses, turning car ownership into a condition of employment. Rural area: one plant closure or hospital downsizing can remove a major local employer, and the nearest alternative may be an expensive drive away.
A higher wage floor can raise earnings for covered workers, while employers may respond through prices, staffing or hours. Effects vary across places and businesses, and cost-of-living differences matter. A credible debate tests these outcomes rather than assuming either that wage mandates solve poverty or that they inevitably destroy jobs.
4. Housing: the largest bill and the hardest one to escape
Housing can turn a working household into a crisis household without any dramatic change in income. The Department of Housing and Urban Development’s 2025 report to Congress identified about 8.46 million very-low-income renter households with “worst case” housing needs in 2023: unassisted renters paying more than half their income for housing or living in severely inadequate housing. The report counts conditions in 2023, not 2025 or 2026.
In an inner-city neighborhood, displacement can follow rent increases, property-tax shifts passed through to tenants, redevelopment or a sale to a new owner. In a suburb, an apartment resident can be just as burdened while being invisible behind a landscape of single-family homes. In rural places, rents may be lower in nominal dollars but housing stock can be older, sparse, costly to heat or far from work and medical care. Where few homes are built, both owners and renters have limited options.
Racial patterns cannot be collapsed into one narrative. HUD found the largest number of worst-case households among non-Hispanic White renters in 2023, reflecting population size, while Black and Hispanic households made up a larger share of worst-case cases than their shares of the overall population. Counts and rates answer different questions. A predominantly White former industrial town and a predominantly Black neighborhood can both experience rent distress, with different histories and financial buffers.
What cities are trying
Philadelphia, Pennsylvania: in April 2026, the city expanded eviction legal representation to ten ZIP codes for eligible tenants at or below 200% of the federal poverty level. The city reports that housing was preserved in more than 70% of right-to-counsel cases with known outcomes in fiscal 2025. That is a program outcome, not proof that lawyers alone caused the result. The ZIP-code design also illustrates the limits of geographic eligibility.
New York City: a broader right-to-counsel program provides legal help, but implementation is not the same as universal representation in practice. The city comptroller documented falling representation rates amid rising eviction pressure. A right written into law can be weakened by too few attorneys or overwhelmed service providers.
Minneapolis, Minnesota: inclusionary zoning requires affordable units in certain qualifying developments. The tradeoff is familiar: affordability requirements can secure units, but feasibility, financing and the total supply of new construction also matter. Cities must evaluate how many homes actually get built and for whom.
For the historical stakes of displacement, see Apep Bar’s Boston investigation and report on the global housing divide.
5. Food insecurity: plenty of food, uneven access to it
The United States is a major agricultural producer, yet the USDA’s 2024 survey found 18.3 million households—13.7%—experienced food insecurity at some point that year, and 5.4% experienced very low food security. Food insecurity is not identical to constant hunger: it measures uncertain or limited access to adequate food because of economic constraints.
USDA’s 2024 food-security report found food insecurity among 24.4% of non-Hispanic Black households and 20.2% of Hispanic households, compared with 10.1% of non-Hispanic White households. It also found a geographic split: 16.0% in principal cities, 15.9% in rural/nonmetropolitan areas and 11.9% in suburban areas. Those are rates, not numbers of households; populous suburbs still contain many families in need.
The question “Why don’t we just give away the extra food?” deserves more than a sneer. USDA has estimated that 30–40% of the U.S. food supply goes uneaten, based on older estimates of loss and waste. But food unsuitable for human consumption, cold-chain costs, transport distances, liability practices, short shelf lives and the need for dignified dietary choices mean waste cannot simply be redirected into universally available meals. Food rescue and better distribution can help; sustained purchasing power and access matter too.
City example: a corner store may be nearby yet offer expensive, limited fresh food. Suburban example: a food pantry could be several bus transfers away from a household without a car. Rural example: the only supermarket may be 30 miles away, and a food bank’s deliveries can be weather-dependent. A single national intervention will not solve all three logistical problems.
State response—Maine: public-school meals are universally free. The state’s April 2026 announcement said approximately 170,000 students were eligible and more than 30 million meals were served in the 2024–25 school year. Such programs address the school-day meal bill and stigma, but not weekend groceries, summer transportation or a family’s rent.
6. Child care and education: the bills that can make work impossible
Child care sits at the intersection of wages, gender, family structure and geography. Child Care Aware of America’s 2025 analysis, drawn from 47 states with available prices, estimated a national average annual child-care price of $13,184. That is not the fee in every county and not what every family pays. The Department of Labor’s county-level database shows why geography and a child’s age matter.
For a parent paid $15 an hour with an irregular schedule, the fee can consume an enormous portion of take-home pay even before transportation. A shift ending at midnight may require care outside standard operating hours. An inner-city family may confront long waiting lists; a suburban worker may drive in opposite directions to work and care; a rural family may have no licensed infant-care openings nearby.
Because women still disproportionately shoulder unpaid care in many households, price and availability can affect labor-force participation. But the same barrier affects single fathers, grandparents raising children, LGBTQ+ parents and families of every racial identity. Race interacts with household wealth and job flexibility; it does not prescribe who needs help.
Education continues the pattern. A district with fewer available resources may struggle to retain teachers, expand career programs or provide transportation and counseling. Housing segregation and local tax bases interact with state school-finance formulas, but the severity and mechanics differ by state. A stronger investigation examines each district’s actual funding and student outcomes rather than treating a ZIP code as destiny.
7. Healthcare: the address can determine the distance to help
Medical need does not obey city limits, but insurance eligibility, nearby clinicians and hospital finances do. Census estimates put the number of people uninsured all year in 2025 at 26.7 million, or 7.9% of the population. Insurance itself does not eliminate deductibles, delayed care or medical debt.
The rural story is particularly stark: the federal Health Resources and Services Administration reports 152 rural hospital closures from 2010 through 2025. A closed hospital may mean longer emergency transfers, fewer jobs and more difficulty securing maternity care. That affects White residents in Appalachia, Black residents of the rural South, Hispanic agricultural communities and Native residents living far from specialty services—not equally, but often through the same lack of distance-sensitive infrastructure.
Urban residents may live nearer a major hospital yet still confront coverage gaps, debt or crowded specialty services. Suburban residents may have cars and insurance but face out-of-network bills and long drives to clinics accepting Medicaid. Rural residents may need to travel to a different county even for routine appointments. A map of hospital buildings is not a map of affordable, timely treatment.
A state border can change medical eligibility
As of KFF’s November 6, 2026 tracking, 41 states including Washington, D.C. had adopted Medicaid expansion while ten had not. North Carolina implemented expansion on December 1, 2023. Texas has not adopted the ACA expansion. This is not an all-purpose comparison of their health systems: program enrollment, provider capacity, state rules and other sources of insurance still matter. It shows how the same income and medical need can face different eligibility pathways on either side of a state line.
Apep Bar recently examined the linked story of hospitals, corporate pressure and access in America’s Vanishing Hospitals. Financial ownership and operational decisions deserve scrutiny, but the reasons a particular hospital closes must be demonstrated, not assumed.
8. The hidden tax of distance: cars, gas, time and isolation
Transport often escapes poverty debates because it is filed as a private consumer choice. For many households, it is a job requirement. In 2025 Census commuting estimates, 69.8% of U.S. workers drove alone to work, while only 3.8% used public transportation. National averages hide substantial differences among large transit cities, auto-oriented suburbs and rural counties.
In a dense city, a discounted transit pass can unlock employment—but late-night service, inaccessible stations and safety concerns still matter. In an outer suburb, the same job may require keeping an older car running, paying insurance and absorbing a surprise repair. In rural communities, a vehicle may also be the only practical route to groceries, court, a pharmacy or a prenatal appointment. A low-rent address 40 minutes from work may be expensive after fuel, time and lost shifts are counted.
Access differences also reshape public programs. An online benefits portal assumes reliable broadband and document-scanning access. An in-person appointment assumes transport, time off and child care. Policies that look uniform on paper are not equally usable in practice.
9. The “poverty penalty”: when having less costs more
Financial fragility often has compounding costs. A missed rent payment can trigger fees or eviction proceedings; a broken car can cause a lost shift; a high-interest emergency loan can leave less for next month’s food. Those mechanisms are not unique to one race or region. Their effects are typically harder to absorb for people with little savings or available credit.
Housing court and administrative systems illustrate the stakes. Philadelphia’s and New York City’s legal-defense approaches recognize that the cost of a lawyer can alter a tenant’s practical ability to contest an eviction. But legal representation cannot generate an apartment that is genuinely affordable or make a landlord pay for structural repairs. Likewise, regulating fees cannot fully replace adequate wages or cash reserves.
Vulnerability can turn into a debt cycle even without a single villain. Some costs follow ordinary insurance risk, supply scarcity or delivery expense; some reflect policy design; some may reflect insufficient competition, excessive charges or abusive conduct. An investigation must distinguish these mechanisms before naming a culprit.
10. Is “greed” the explanation—or a hypothesis that needs testing?
Distribution matters. The Federal Reserve’s wealth data reveal uneven ownership of financial and housing assets. Corporate concentration and pricing power can affect essentials. The Federal Trade Commission’s 2024 grocery supply-chain examination reported that some large market participants were able to protect or expand margins amid pandemic disruptions and price spikes. That finding merits competition scrutiny. It does not establish that every increase in grocery prices was caused by profiteering or that every food retailer behaved identically.
Economists also point to genuine constraints: too few homes in high-demand regions, scarce child-care staff, thin rural provider networks, insurance costs, logistical waste and energy prices. Policies intended to help one group can impose costs elsewhere; raising benefits requires public revenue, while expanding housing supply can run into infrastructure and financing limits. These considerations do not invalidate concerns about exploitation. They provide testable competing explanations for high prices.
“There is enough for everyone” is defensible as an aspiration and, in some domains, a statement about aggregate capacity. It is not a demonstrated claim that all needs can be met immediately without new spending, construction, staffing or distribution systems. The serious question is which avoidable barriers keep people from the resources that already exist—and who benefits from those barriers.
11. The American policy patchwork: what different governments are doing
Tax credits: Minnesota, California and Colorado
Minnesota offers an income-tested, refundable child tax credit of up to $1,750 per qualifying child for tax year 2025, with phaseouts. California offers its own earned-income and young-child credits for eligible taxpayers. Refundability matters because a family with little income-tax liability may still receive support; eligibility and filing requirements mean not every family qualifies.
Colorado provides a contrasting example of how public revenue changes the deal. Its Department of Revenue says the Family Affordability Tax Credit is temporarily paused for tax year 2026 and the state EITC match falls from 50% to 25% of the federal credit for that year. Eligible households may see smaller refunds in calendar year 2027. This is a budget-linked policy change, not a universal elimination of assistance.
The cash-transfer question is not merely whether a state creates a credit. Policymakers must examine how easily families can claim it, when the money arrives, what costs rise around them and whether public budgets can sustain it.
Housing defense: Philadelphia, New York City and Minneapolis
Philadelphia emphasizes legal defense in specified ZIP codes and eviction diversion; New York City has a citywide legal-right framework but faces capacity pressures; Minneapolis uses land-use requirements to secure some affordable units during development. These interventions operate at different stages: preventing a legal loss, addressing court representation, or influencing the housing stock. None is a substitute for the others, and each needs independent outcome evaluation.
Food and health: Maine, North Carolina and Texas
Maine spreads school meal access across income groups, aiming to reduce both household food costs and stigma. North Carolina expanded Medicaid eligibility for many low-income adults. Texas has a different eligibility framework because it has not implemented ACA expansion. Their choices involve distinct financing, legislative and administrative tradeoffs. What matters for residents is concrete: eligibility, available providers, out-of-pocket expenses and whether help is reachable.
Minimum wages: Seattle and states with a federal-level floor
Seattle’s high local wage floor contrasts with the federal $7.25 rate applicable in places including Texas. But higher pay on paper must be evaluated against rent, hours, labor-market effects and the right to enforce wage laws. A statewide average conceals rural versus urban costs, and a city ordinance does not necessarily extend to the next suburb.
12. Three America-sized blind spots
Inner-city poverty is visible—and easily stereotyped
Highly visible homelessness and disinvestment attract cameras, sometimes eclipsing stable neighborhoods and community organizations. Density can provide nearby services and jobs, but unequal housing markets, safety concerns, historical segregation and costly rents make those resources harder to use. The people affected include families and older residents across racial groups, not a single imagined “urban poor” profile.
Suburban poverty is often numerically large—and administratively hidden
A Brookings analysis of 2019–2022 Census data found more than 60% of the increase in Americans living in poverty during that period occurred in major metropolitan suburbs. The suburban poverty rate remained below that of primary cities—about 9.6% versus 16.2% in 2022—but the large population base and spread-out service geography create a different problem. This is a historical 2019–2022 comparison, not a new estimate for 2026.
A household can live among manicured lawns and still be choosing between food and prescriptions. The bus route, rental legal clinic and food pantry may have been designed around a poorer downtown from which hardship has spread outward.
Rural poverty is dispersed—and easily missed
Rural areas have distinctive constraints: long travel distances, limited broadband, housing-quality problems, smaller job markets and a fragile medical-service network. They encompass majority-White communities in parts of Appalachia, Black Belt counties in the South, Native nations with separate governance and infrastructure challenges, and agricultural regions with migrant-worker populations. A county average cannot substitute for reporting on each community’s history and public resources.
13. What would actually demonstrate progress?
Rather than count announcements and press releases, evaluate whether a policy changes measurable conditions: severe rent burden and involuntary displacement; local food insecurity; the cost and availability of child care; travel time to emergency and routine care; take-home pay after necessary work expenses; administrative take-up and denials of benefits; and wealth accumulated by households previously excluded from credit.
Break those measures out by race and geography, rather than looking at one dimension in isolation. Compare people within similar household structures and labor markets where appropriate. Publish the denominators, distinguish city cores from suburbs, and do not present a lower rate as evidence that a larger total number of affected residents has disappeared.
Independent audit trails matter too. If a city credits an eviction initiative for a lower filing rate, compare comparable neighborhoods over time and assess other changes. If a tax credit raises income, examine whether rents or child-care charges offset part of it. If new housing is approved, count what is built, at what price, and who can actually move in. A policy can be directionally promising while its benefits are uneven or difficult to measure.
The uncomfortable question is not just who has enough—but who can reach it
America’s poverty debate often forces a false choice: blame individual decisions or blame a single class of villains. The evidence points to an interconnected system of wages, ownership, historical barriers, housing scarcity, medical coverage, care responsibilities, transportation and political decisions. Private firms make choices within that system; lawmakers and administrators design many of its rules. Both deserve scrutiny when the evidence supports it.
There is substantial national wealth and substantial unmet need. That contradiction warrants investigation, not an automatic conclusion about any person’s intentions. Some interventions already have measurable effects. Others remain partial, underfunded, poorly targeted or difficult to reach. And the same program can look very different from a Philadelphia courtroom, a Minneapolis apartment complex, a Texas clinic or a rural hospital’s former emergency department.
If poverty is experienced locally but its causes run through national markets and state law, who is responsible for making sure a person’s ZIP code no longer determines which basic necessities they can afford?
Method, sourcing and evidence limits
This is a researched analysis based on public sources, not firsthand interviews. Its central annual datasets measure different things in different years: Census official and supplemental poverty in 2025; USDA household food security in 2024; Federal Reserve family wealth in 2022; HUD housing needs in 2023; and laws or agency reporting current through November 11, 2026. They should not be merged into a single invented composite statistic. Examples of households are explicitly illustrative. Local policy outcomes attributed to municipalities are not presented as independently established causal effects. The linked NewsBreak article’s full text was not accessible for verification, and no specific unverified subtopic is attributed to that source.
Primary sources and further reading: Census—Poverty in the United States: 2025; USDA—Food Security in the United States: 2024; HUD—Worst Case Housing Needs, 2025 report; Federal Reserve—Racial Wealth Gaps; U.S. Department of Labor—State Minimum Wages; KFF—Medicaid Expansion Decisions; Brookings—Suburban Poverty.
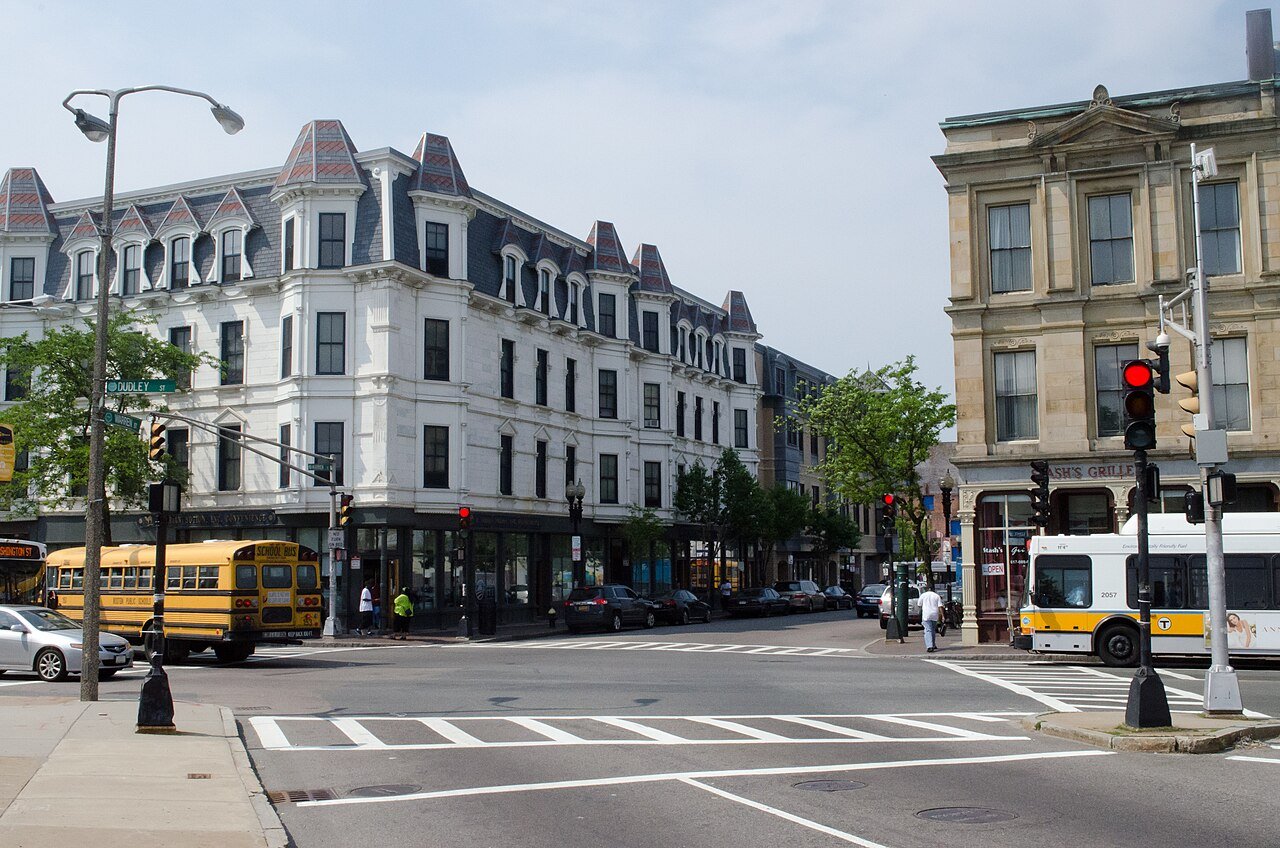
Featured image context and credit: Documentary photograph of Dudley and Warren Streets, Roxbury, Boston (June 2011), by Tim Pierce, via Wikimedia Commons, CC BY-SA 3.0. This is a location photograph relevant to housing and urban opportunity—not a photo of the poverty statistics or a particular household described above.